In recent years, the crypto industry has been booming, a new addition to the financial market. Cryptocurrencies are digital assets that investors can trade as other financial assets like commodities, currencies, stocks, etc. Using leverage is popular among financial traders that enable multiplying profits when trading forex, commodities, stocks, etc.
However, it is mandatory to follow specific leverage trading crypto strategies alongside learning the functionalities when a crypto investor decides to use leverage in crypto trading. This article will introduce you to leverage in crypto trading that is also valid for traditional markets alongside describing leverage crypto trading strategies.
What is leverage in crypto trading?
Leverage crypto trading can be confusing to novice crypto traders. This term “leverage” refers to borrowing capital to make trades that amplify investors’ buying/selling power. It allows investors to participate in larger trades with small means that traders typically use as collateral.
We know the crypto market is a volatile marketplace. While leverage can multiply potential profits, it may lead investors to substantial losses when the market moves against your positions. Investors can borrow up to a hundred times their account balance through leverage depending on their crypto exchange platforms. The crypto exchange platforms usually define the leverage amount as a ratio such as:
- 1:5 (5X)
- 1:10 (10X)
- 1:20 (20X)
It usually refers to how much investors can borrow or multiply initial capital. For example, an account with 1:5 leverage multiplies the capital five times.
How to trade crypto using leverage?
First, investors need to deposit funds to start crypto trading with leverage. The initial capital is the collateral, and you can use leverage depending on your collateral. For example, you may have a $100 capital in your account and invest $500 in any crypto, say ETH.
So you need to use 1:5 leverage that will multiply your collateral five times. If you use a 1:10 leverage, it requires a lower margin than your $100. In this case, with a $50 deposit, you can open trade worth $500. You can use leverage for both your long and short positions. While opening long positions means you expect the price will rise.
Meanwhile, investors open short positions when they expect the price to decline. Investors can blow their accounts on requires to add more collateral in expectation of recovery when the price moves against their trades.
Short-term trading strategy
We use the two most popular technical indicators in this short-term trading method:
- Volume indicator
- MACD
MACD shows readings in an independent window, and the volume indicator shows readings below the chart through green and red bars for buying and selling pressures. This trading method suits any financial asset on many time frames. We recommend using a 15-min or hourly chart to catch the most potent short-term trades.
Bullish trade scenario
When seeking to open buy positions, observe:
- The volume indicator declares increasing buy pressure.
- The dynamic blue line crosses the dynamic red line on the upside at the MACD window.
- MACD green histogram bars take place above the central line.
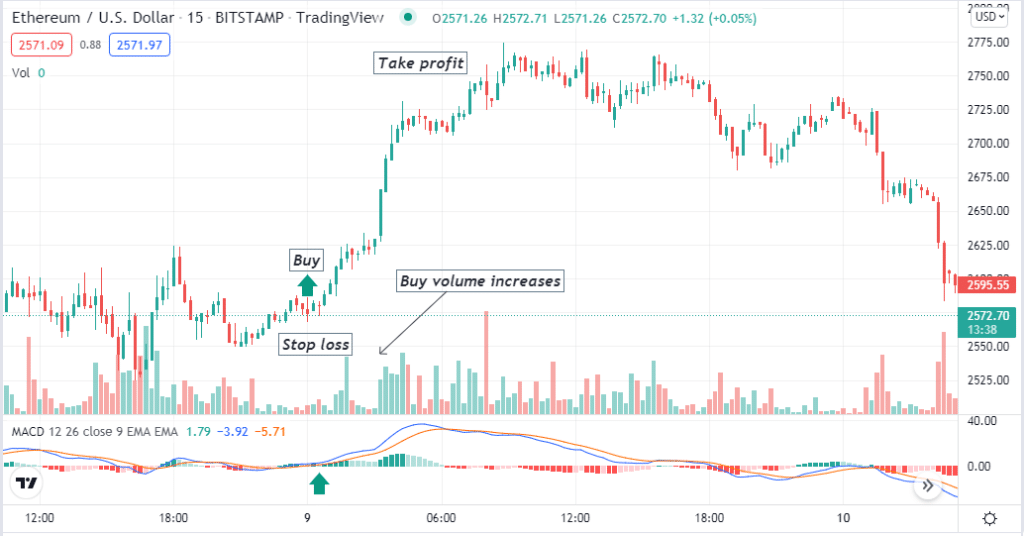
Entry
Match these conditions above and open a buy position.
Stop loss
The initial stop loss will be below the recent swing low.
Take profit
Close the buy order when:
- The volume indicator declares increasing sell pressure.
- The opposite crossover occurs between the MACD dynamic lines.
- MACD red histogram bars take place below the central line.
Bearish trade scenario
When seeking to open sell positions, observe:
- The volume indicator declares increasing sell pressure.
- The dynamic blue line crosses the dynamic red line on the downside at the MACD window.
- MACD red histogram bars take place below the central line.
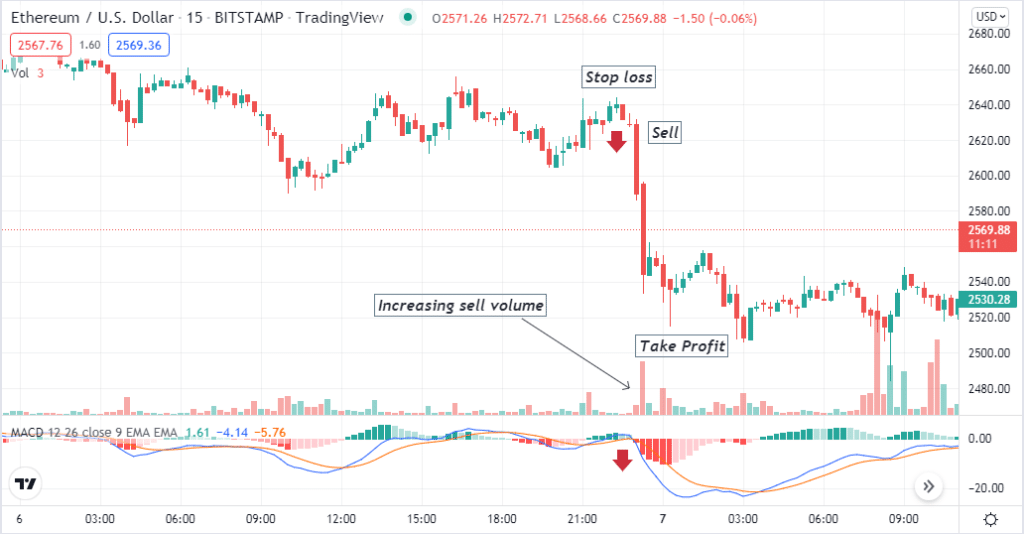
Entry
Match these conditions above and open a sell position.
Stop loss
The initial stop loss will be above the recent swing high.
Take profit
Close the sell order when:
- The volume indicator declares increasing buy pressure.
- The opposite crossover occurs between the MACD dynamic lines.
- MACD green histogram bars take place above the central line.
Long-term trading strategy
This long-term trading method contains two easily applicable technical indicators:
- Parabolic SAR
- RSI
Parabolic SAR defines the trend and swing points by parabolic dots above and below price candles. A series of dots below price candles represent bullish momentums and vice versa for bearish trends. Meanwhile, the RSI indicator measures the magnitude of price movements alongside showing the oversold and overbought conditions. We recommend using an H4 or daily chart to analyze and determine trade entry/exit points when generating long-term ideas through this trading method.
Bullish trade scenario
When determining buy positions, observe:
- The parabolic dots take place below price candles.
- The dynamic blue line of the RSI indicator window is near the central (50) line heading on the upside.
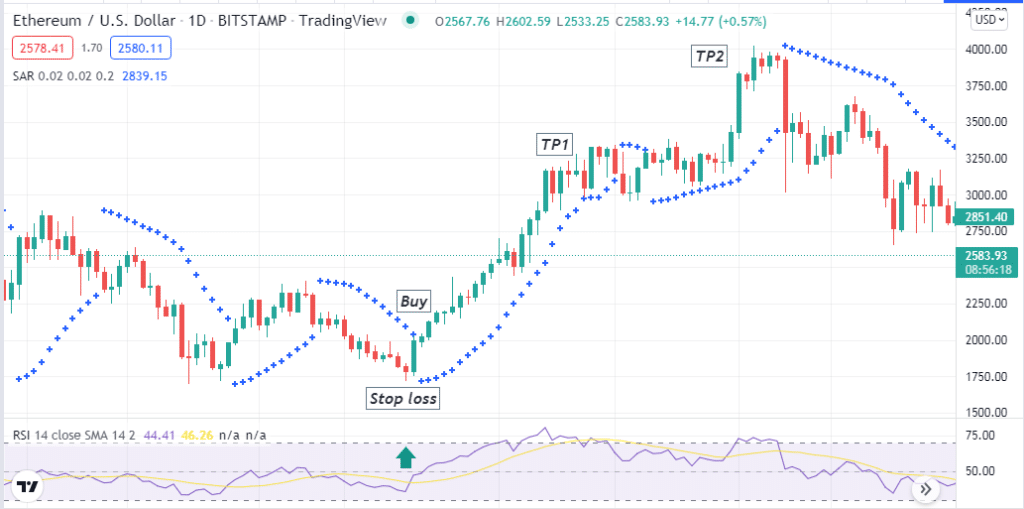
Entry
If these conditions above match your target asset chart, it declares sufficient bullish pressure on the asset price. Open a buy position.
Stop loss
Place an initial stop loss below the current bullish momentum.
Take profit
Close the buy position when:
- Parabolic dots switches above price candles.
- The dynamic blue line of the RSI window reaches the upper (70) level or starts declining after getting that level.
Bearish trade scenario
When determining sell positions, observe:
- The parabolic dots take place above price candles.
- The dynamic blue line of the RSI indicator window is near the central (50) line heading on the downside.
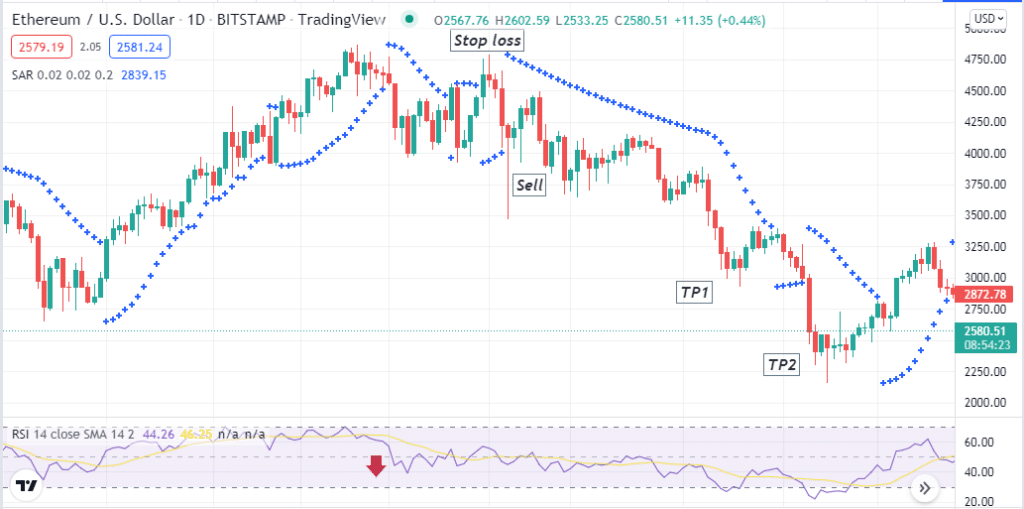
Entry
If these conditions above match your target asset chart, it declares sufficient bearish pressure on the asset price. Open a sell position.
Stop loss
Place an initial stop loss above the current bearish momentum.
Take profit
Close the sell position when:
- Parabolic dots switches below price candles.
- The dynamic blue line of the RSI window reaches the lower (30) level or starts surging upside after getting that level.
Upsides and downsides
Leverage crypto trading is standard among crypto investors, and it also involves some drawbacks. Let’s look at the significant upsides and downsides.
| Upsides | Downside |
| Multiply profits Leverage crypto trading enables multiplying profits. | Greater loss Crypto investors can blow their accounts while practicing leverage crypto trading. |
| Diversification Leverage enables diversifying crypto investors’ portfolios. | Risky way Leverage crypto trading is risky as the marketplace is volatile. |
| Discipline Leverage trading teaches risk management and discipline. | Harder Leveraging crypto trading is harder for novice crypto investors. |
Final thought
You can consider leverage crypto trading as the most pleasing way to earn digital money. Novice crypto investors who don’t have the skills to participate in constantly profitable trades, leverage crypto trading can be daunting for them, and they even can lose their entire capital.