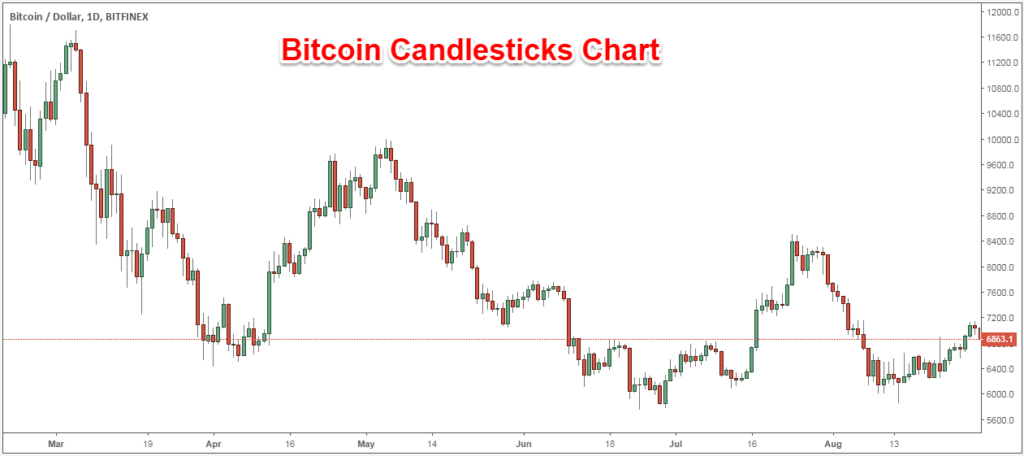
It’s important to know which crypto to invest in and when. You may come across a candle chart of a price graph while studying crypto assets. As a result, it’s a good idea to spend some time learning about these.
Line and bar graphs have horizontal and vertical axes, and candlestick graphs do the same. However, candle charts provide a more significant amount of data compared to bar charts.
For example, in candlestick charts, any time frame can be selected to display the asset’s highest and lowest values, as well as its opening and closing prices.
What are candlestick charts, and how do they differ?
Using candles, you may determine whether or not a market’s price change was positive or negative and by how much. When looking at a timeline, it may show a pretty different time frame.
Unlike stock markets, Bitcoin and other cryptos are traded around the clock on crypto exchanges. It’s possible to modify the timing on Coinbase Pro. For example, the default is six hours, each candle representing five minutes. Since the beginning and end of a period are marked by “open” and “close” prices, respectively.
Anatomy of a candlestick
The open, close, high, and low are all included in a chart to show the price movement of a single item throughout a specific period.
For each candlestick’s “open,” we can see the current price of an asset, while for the “close,” we can see how much an item has dropped in value. High and low prices are the highest and lowest prices specific essential found in a single trading day.
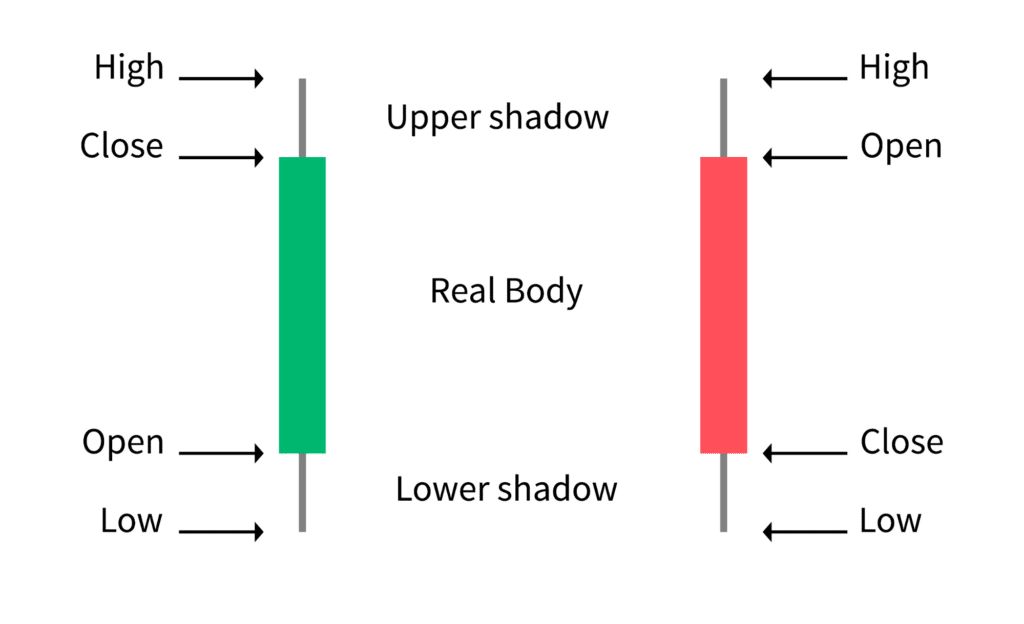
Each candle has two physical characteristics that display the four essential components:
- The large middle piece, referred to as the body, depicts the open and close of the candle during the observation time.
- At the top and the bottom of the body are two candlesticks, one green and one red, representing the closure.
- Open, which forms the bottom of the green candle and top of the red candle, is the opposite of closed.
- As the candlestick’s second distinguishing feature, the wick depicts the apex and base of the candle’s flame. Thin lines running above and below the body are depicted to represent wicks.
What can we infer from candlesticks?
Candles can reflect more than just price fluctuations throughout time. Experienced traders look for patterns to analyze market sentiment and predict the market’s future move. To give you an idea of what they’re searching for, consider the following:
- Many candle patterns can tell you whether an asset is going up or down. Like a long wick at the bottom of a candle shows buying pressure.
- Traders may be eager to make money, which might lead to a significant sell-off shortly soon to an extended wick at the top of the candle.
- It could indicate either a solid extended bullish or bearish sentiment if the candle’s body fills almost the entire candle with short wicks on either side of it (on a red candle).
A key component of technical analysis is understanding what candlesticks mean in the context of an asset or market conditions. It is done by looking at past price movements and comparing them to current prices.
How to read the price pattern?
It is possible to utilize and interpret the candle chart in several ways to make a 3x profit. You must choose a trading strategy and a period beforehand to use candlestick chart analysis. Some trading strategies rely on spotting price patterns, while others look for candle formations to get an edge.
Interpreting price pattern in a single candle
An individual candlestick gleans about a wealth of information regarding market sentiments. Various candlesticks are used to gauge price momentum and potential future direction, such as the hammer, shooting star, and hanging man.
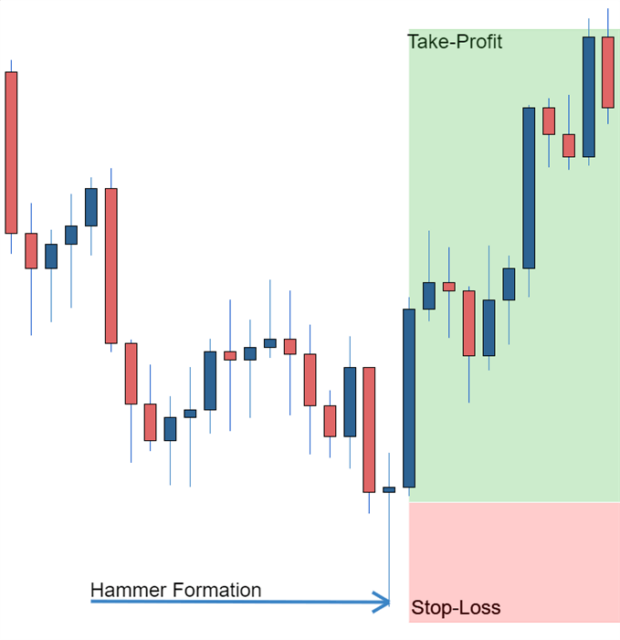
As seen in the figure below, the hammer formation may indicate a change in trend. These candles have a small body with a long lower wick. In comparison to the opening price, the closing price is higher. Prices tried to fall but were met by purchasers who drove prices up, thereby forming a hammer formation. Positive signals include entering the market, tightening stop-loss orders, or closing a short position.
Trades can take advantage of hammer formations once this candle has closed. Hammer candles are excellent for setting ‘tight’ stop-loss orders for traders. The risk-to-reward ratio should be positive when setting take-profit targets. Consequently, the profit target surpasses the loss target.
Interpreting price patterns in multiple candles
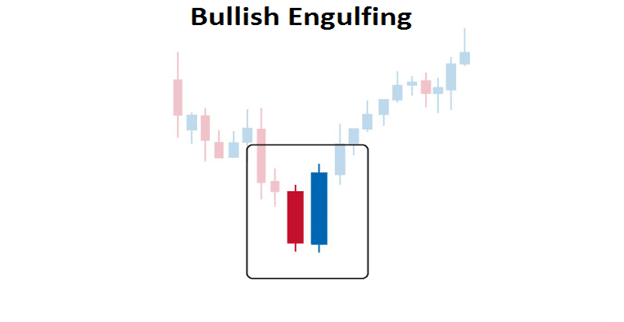
Market analysts use candlestick charts to spot price patterns in the market. You can profit from price patterns such as bullish engulfing or triangular patterns if you know how to recognize them.
You can see an example of this bullish engulfing pattern in the image below. The blue candle entirely engulfs the red candle in a bullish engulfing. Long-term weakness in a currency pair may be coming to an end. An investor would take advantage of the close of the blue candle by opening an extended position. Do not forget to pay attention to the price pattern, which only appears following the closing of the second candle.
To ensure a tight stop loss, a trader would place a stop loss underneath the bullish engulfing pattern, comparable to the hammer formation. Afterward, the trader would settle on a profit goal. To learn more about forex candlestick charts, check out our forex candlesticks guide, which goes through the advantages of candlestick charts and the strategies utilized with them.
Upsides and downsides of crypto candles
| Upsides | Downsides |
| A single candle may represent any asset. The data stream is the only thing holding us back. | Charting pattern provides too much information, which may confuse you or clutter the charts for trading. |
| These charts have an appealing visual appearance on a screen, and most charting systems allow users to customize the colors and contours to their liking. | There are unknown movements. Unless you are witnessing a bar develop in real-time, retroactively, a trader has no notion what came first, the low, or the high. |
| They are ideal for most indicators. In addition, such charts are often necessary when indications are essential to a particular trading method. | Gaps are common in candle charts. For example, if one candle shuts at a certain level, the next may open at a different level. |
| To see who’s in charge of a market or how it’s doing, you may use candlestick charts to see how the market has changed during the period. | These graphs may be used to highlight a variety of biases. Nevertheless, consistent indications will still be generated through technical analysis. Even more so now that indicators have been included. |
Final thoughts
As Japanese rice traders discovered centuries ago, investors’ emotions around an asset’s trading substantially impact the price movement. To create more accurate predictions regarding future direction, traders might use candlesticks to determine their emotions, which helps them make x3 Profit.