
Have you been trading with indicators for some time without success? With literally thousands, if not tens of thousands, of technical indicators floating around the internet, you might be jumping from one indicator to another, hoping to find the best. However, the result is only confusion and hopelessness.
Due to computerization and the internet revolution, anyone can create an indicator that seems to do some magic. After a while, it loses its efficacy, and you go hunting again for the next indicator. If you are learning how to trade, indicators might be helpful. However, you might need something simple to understand the market process and trade appropriately.
What you need to trade profitably is price. Price is king, and you can trade the currency market without indicators. In this post, you will learn some techniques to trade a naked chart. You will also understand important concepts that can help with naked chart trading.
What is naked forex trading?
Naked trading is a trading strategy that involves using a naked chart unaided by technical indicators of any sort. To find trades, naked traders focus on how price reacts at essential points on the chart. These points are horizontal or angled lines on the chart that price tends to repeatedly respect. We call the horizontal lines classical support/resistance and the angled lines trend lines. These lines are not just levels but areas or zones.
As a naked trader, you need to identify these key areas on the chart on any timeframe. However, the best setups occur on higher time frames, like the four-hour and daily chart. The best thing you can do is mark these areas with lines and then wait for the price to hit these lines. Using specific candlestick patterns or signals, you can determine if the areas are holding and if you can enter trades. You could have taken six profitable buy trades in the image below by waiting for the price to touch a support level and show rejection.
High-probability naked forex signals
Naked chart trading lets you take high-probability signals by studying price action and its interaction with support/resistance levels. We outline four such signals in this section.
Setup 1. The last kiss
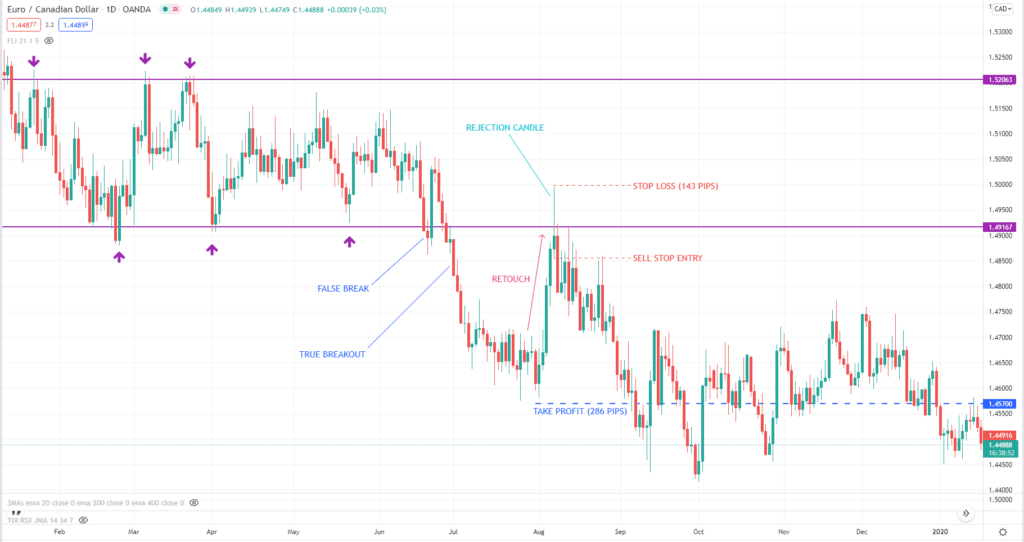
The last-kiss trade is similar to the more familiar break-and-retest setup. You can apply the same concepts to this trade. However, the initial requirement is a consolidation range. The price must print a horizontal range before the breakout. A valid range is one with at least two touches at the top and bottom. The breakout must be strong and dramatic when the price finally breaks out either above or below the range. This means that it should move far from the breakout point before a retest.
The moment the price shows an intention to touch the breakout level, you focus your attention.
- When the price touches the level and rejects it, that is a last-kiss trade you can take.
- When the setup forms, place a pending sell stop order at the low of the rejection candle for a sell.
- Then put the stop loss in the middle of the range or at the high of the rejection candle for a sell.
- You can place the take profit at the previous swing low prior to the retest. Alternatively, you can use a target twice the risked amount or pips.
Setup 2. The big shadow
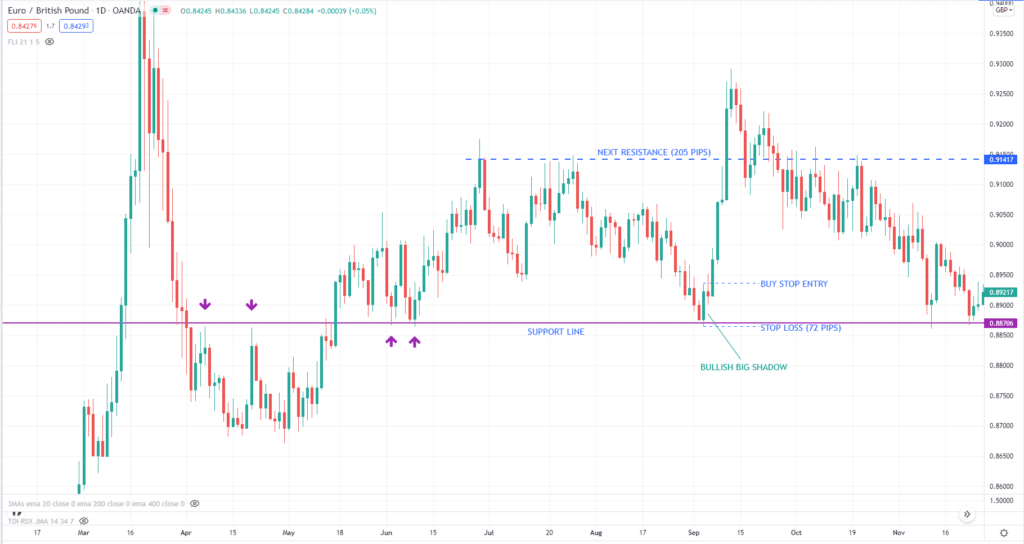
It is a two-candle formation similar to an engulfing pattern or a two-bar reversal. The first candle typically comes close to support or resistance for an engulfing pattern, followed by a giant candle closing in the opposite direction. Meanwhile, for a two-bar reversal, the first candle breaks and closes beyond support or resistance, followed by a more giant candle that closes back within the range, forming a false break in the process.
In the example below, the support level is undeniable. When the price revisits the level from above and forms a big shadow, you have a good idea that the price may reverse upward. Once you see this setup, you can put a buy stop entry at the high of the big shadow candle, set the stop loss at the low of this candle, and target the next apparent resistance as trade exit.
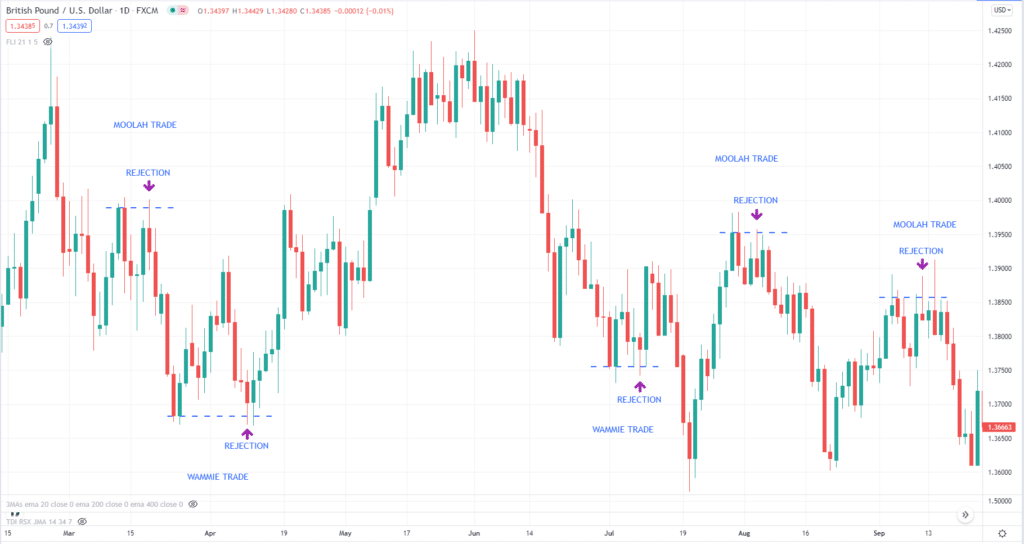
Setup 3. Wammie and moolah
The wammie and moolah trades are familiar setups to traders. You know what these setups are if you are familiar with the double-top and double-bottom formations. Probably the names of the setups are derived from their first letters.
Moolah starts with the letter M, which stands for M formation. Meanwhile, wammie begins with the letter W, which stands for W formation. They are indeed M and W formations if you look at completed moolah and wammie setups.
While many traders think that double-bottom and double-top formations occur every time price revisits support or resistance, that is not an accurate description. If a lot of time has passed before price revisits a price level, consider it mere support or resistance. A legit double-top and double-bottom formation complete in very few candles. It can form in at least five candles.
Take note that the moolah and wammie trades are not simply double-top and double-bottom formations. They combine the concept of 1-2-3 pattern to form a high-probability setup.
- The best moolah setup is one with the second top lower than the first top.
- The best wammie setup is one with the second top higher than the first top.
You can see five of these trades in the daily chart below of GBP/USD.
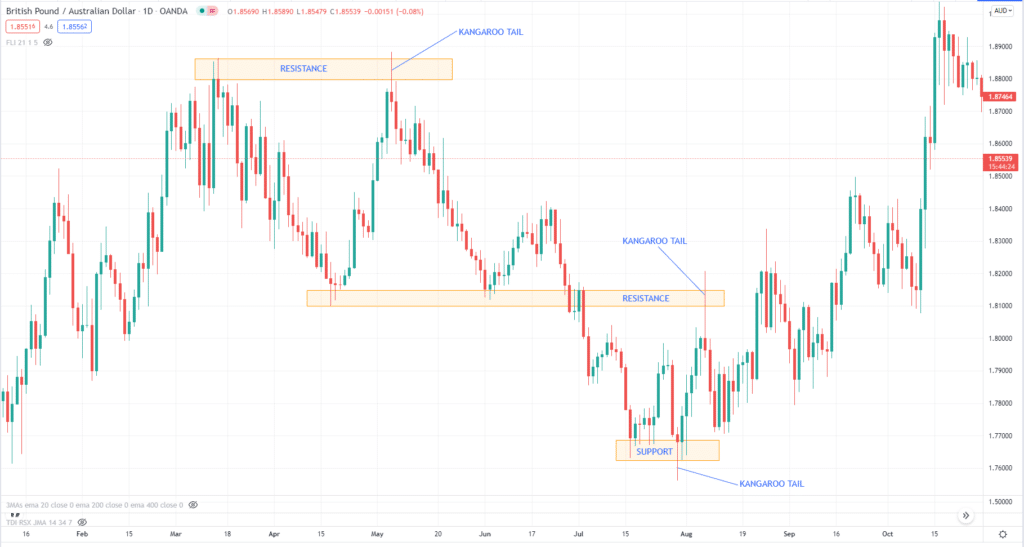
Setup 4. Kangaroo tail
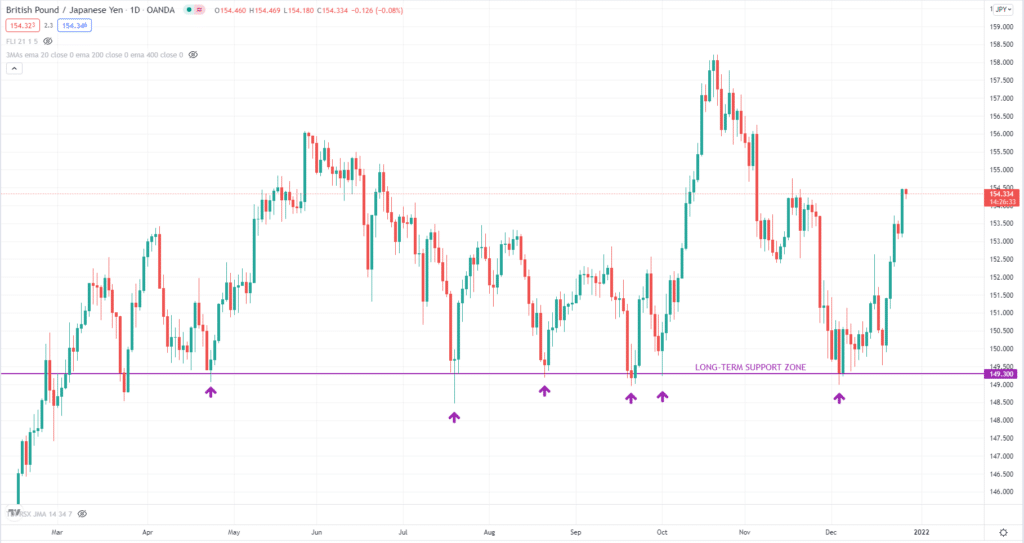
The kangaroo tail is more widely known as pin bar or hammer setup. Normally, you can see the most successful setups forming around long-term support/resistance zones and in unity with double bottom and double top formations. While the location is critical, the signal itself is crucial.
The rejection candle must pierce through the zone and even beyond it in an emphatic fashion. As you can see in the image below, the candle must occur at a superior level and have a long tail. After the trigger candle closes, you can enter the trade right away, put the stop loss at the tip of the tail, and aim for the next area as a target.
Final thoughts
Naked chart trading trumps indicator trading at least for two reasons. First, a naked chart lets you see the true price action. In contrast, indicators seem to hide the real market action due to the number of lines on the chart. Second, trading with a naked chart is not inferior to trading with a battery of indicators. As long as you qualify trades using support or resistance, trend, and candlestick patterns, you can trade profitably with the naked chart.