The FX market is famous for its liquidity and sees enormous daily trading volume daily. Although forex margin trading involves significant risks, some trading strategies and techniques have shown a remarkable success rate.
Correct and disciplined implementation of technical analysis methods can provide substantial profits in the long run. Moreover, each analysis method exhibits a unique market outlook, pointing to diverse possibilities of price variations.
Flag patterns are among the most profitable, low-risk trading setups utilized by all types of traders. This article reviewed the bull flag strategy specifications, types of these patterns, and an example.
What is worth knowing?
- A bullish flag is a pattern that hints at the continuance of the existing trend.
- This flag pattern is a low-risk, high-reward setup that allows the traders to generate significant profits in a volatile market.
- Bull flags can appear in the trending as well as breakout market.
What is a bull flag pattern?
It is a trend continuation pattern that involves a consolidating price after a sharp upward move. The flag refers to the slight price pullback against the ongoing price direction. Traders utilize this pattern to profit from the existing trend as this formation indicates the extension of the previous price move.
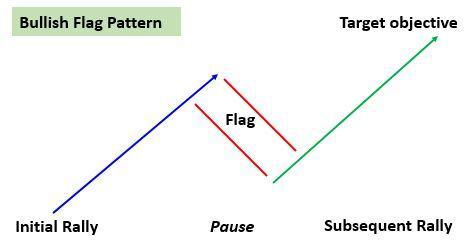
A complete pattern incorporates a pole, flag, and a bullish breakout from the consolidation area. A flag pole is the prior price trend or a sharp uni-directional movement, while the bullish flag is the downward-slanted price region that appears on top of the pole. Traders specify the flag segment by extending parallel lines on its support and resistance levels.
Moreover, traders can identify this pattern on any timeframe by noticing the price direction and extent of pullback. The bull flag pattern differs from the pullback strategy as it manifests a weak pullback with limited retracement and low volume.
How to trade?
To profitably trade this setup, it is essential to consider and verify some factors beforehand. Firstly, the bull flag pattern frequently forms in a volatile market; therefore, you should determine the direction of the price spike where a bull flag could develop.
Afterward, look for sloping price consolidation or a weak pullback above the price pole. Generally, the flag zone price does not retrace more than 38% against the existing trend. In other words, the descending flag should not get lower than the midpoint of the flag pole.
Moreover, it is essential to note that the upper portion of the flag is the potential area of breakout. Look for a clean breakout from the flag resistance or wait for the breakout retest before entering the trade.
Furthermore, specify the trading volume range within the pattern. Bullish flag formation mainly involves a high volume during the price jump (pole) followed by low volume during the price concentration phase.
Types of bull flag patterns
They can form in various market conditions, and two are most common.
Breakout bull flag
Traders look for price breakouts as they are one of the best trading setups and provide a high-profit target. However, the exact moment of breakouts is challenging to specify as they can occur suddenly after an exhausting ranging market.
Therefore, the first pullback or bull flag can serve as an ideal trade entry point after the breakout. To trade this type of setup, wait for the price to breakout and settle, forming a descending flag (weak pullback). Through this method, you can catch the next bullish rally on the break of the flag top.
Trending market bull flag
Bullish flag patterns also form in a strong trending market. These flag patterns allow the traders to enter the market without waiting for a solid pullback to the support level.
To trade a trending bull flag, specify the ongoing upward trend and wait for a flag formation towards a trend line or moving average. You can enter the rising price flow on the break of flag high.
Bullish flag trade setup
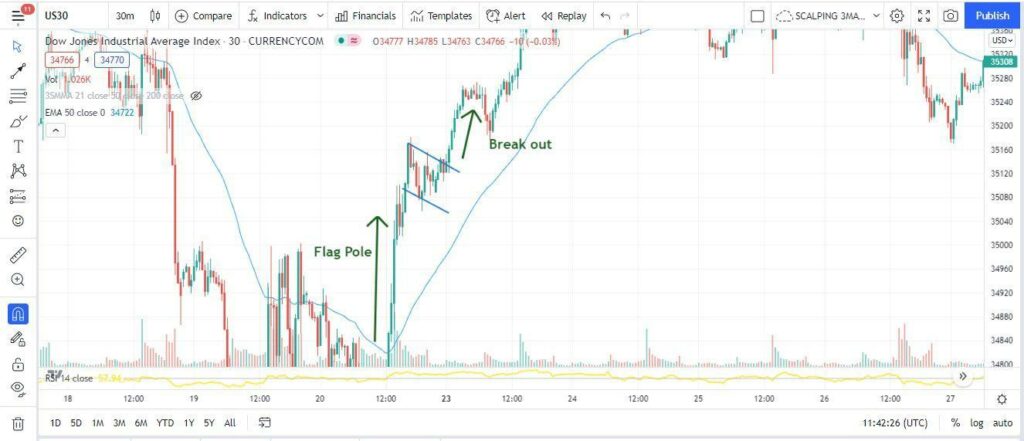
The above US30 chart demonstrates a bullish flag pattern in a 30-minute timeframe. As a first step, you need to zoom out the chart to spot the bullish flag easily. Next, you should specify the flag pole, the area where price surged in the upward direction. Afterward, you must mark the price consolidation zone or flag with parallel lines.
As seen in the above chart, we determined the price pole that might have appeared due to any major news or event. Then, we expected this trend to continue for some time and waited for the slanting pullback of a few candles. This zone would work as an ideal point for entering the trend direction.
Entry
A safe entry point to enter bullish flag trade is to wait for the successful breakout above the flag. Usually, traders wait for the close of the bullish breakout candle to avoid false signals.
In the above example, we entered the trade when the price broke and closed above the upper trendline of the flag.
Stop loss
We set an SL below the bottom point of the flag to maintain a low-risk, high-reward setup.
Take profit
The TP points can vary according to the different trading approaches. Typically, conservative traders set their profit target corresponding to the flag’s width. If the flag consolidation is 25 pips wide, they will collect the profits at 25 pips from the breakout. These traders quickly achieve their targets due to the lower threshold.
In contrast, aggressive traders set their TP according to the length of the flag pole. These traders expect a significant price move equivalent to the initial price spike.
Upsides and downsides
| These patterns appear regularly in the FX and stock markets on all time frames. | These patterns can sometimes exhibit false breakouts leading to losses. |
| This pattern provides a clear-cut setup with specified an SL zone and entry levels, allowing the traders to manage their trade effectively. | The pattern can take significant time to form on large time frames, rendering it unsuitable for aggressive traders. |
| Bullish flag patterns allow good risk-reward trades that can range from 1:2 RR to 1:4 RR. | Some novice traders are unable to differentiate between strong pullbacks and flag patterns, exposing them to risk. |
Final thoughts
Bullish flag patterns are relatively easy to notice and provide good quality trades. Both day traders and swing traders utilize these formations and other indicators to capitalize on the ongoing trend.
Moreover, they are perfectly compatible with the FX market as they frequently appear in volatile conditions. However, traders should follow risk management by designating tight stop losses in case of trend reversals or failing setups.