
Some traders do not like to take trend trades because they know the markets spend most of their time ranging rather than trending. About 70 percent of the time, markets tend to fluctuate randomly or oscillate back and forth within a trading range. Markets spend the rest of the time making unidirectional movements that break support and resistance. This is what we know as a trend.
While it is true that you can find the market ranging more than trending most of the time, that does not mean you cannot trade trends. When the market transitions from ranging to trending, that is the time when you can make a lot of pips, though it lasts only for a while.
In this article, you will learn a simple method on how to benefit from short-term currency trends. This strategy involves the use of the following:
- Two time frames to identify the trend.
- Overbought/oversold indicator to pinpoint entry.
- Trailing stops to protect gains on profitable trades.
If you want to give trend trading a try, learn the system in this post.
How to capitalize on trends
Although the odds of success in trend trading are not favorable for traders, the potential reward is still worth the risk. What you can do as a trader to capitalize on short-term trends is to identify trends, locate entry points in the context of the trend, and use control risk through proper risk management.
This post will present a trend trading system that works best in the foreign exchange market, particularly with the major currencies, namely:
- US dollar
- Euro
- Japanese yen
- British pound
- Swiss franc
- Canadian dollar
- Australian dollar
However, you can still use this system with other markets as long as you can see trends in those markets.
Trading system tools
To trade this strategy, you will use the following:
- 15-minute and hourly chart
- 200-bar EMA
- 14-bar slow stochastic study
Trading system rules

This section outlines the steps you should take to trade this system. There are only steps involved when trading this system, as outlined below.
Check if the asset is trending
Select a currency pair you would like to trade and then determine if the pair is trending. If not, find another pair. First, go to the hourly chart and see if the price is trending above or below the 200 EMA. Next, go to the 15-minute chart to see if the price is also doing the same thing. A trend is in place when the price is consistently above or below the moving average (MA) on both charts.
Find an entry
Once you have identified a trend, look for the following two conditions to occur at the same time on the 15-minute chart:
- Price is within 20 pips above the 200 EMA for a buy or 20 pips below the 200 EMA for a sell.
- The stochastic mainline crosses above the stochastic signal line below the 20 level for a buy or crosses below the signal line above 80 for a sell.
When the above conditions happen, we can make the following conclusion:
- The currency pair is currently in a short-term uptrend or downtrend.
- The instrument has paused or pulled back (reflected by the higher low stochastic reading and the price within 20 pips from the 200 EMA). It is poised to turn around to continue the trend because the stochastic mainline is crossing back above or below the signal line.
Ride the trend
Use a trailing stop instead of a fixed take profit target to monitor a winning trade. Put the stop loss ten pips below the 200 EMA on the 15-minute chart for a long position during entry. In the case of a short position, place the stop loss ten pips above the 200 EMA.
As the trade goes in your favor, raise the stop for a long trade or lower the stop for a short trade to protect profits. You can use a trailing stop of your choice, but we recommend using the previous swing high or swing low as dynamic stop loss placement as you ride the trend.
Trade example
Let us look at a trade example to see how to implement the system in trading.
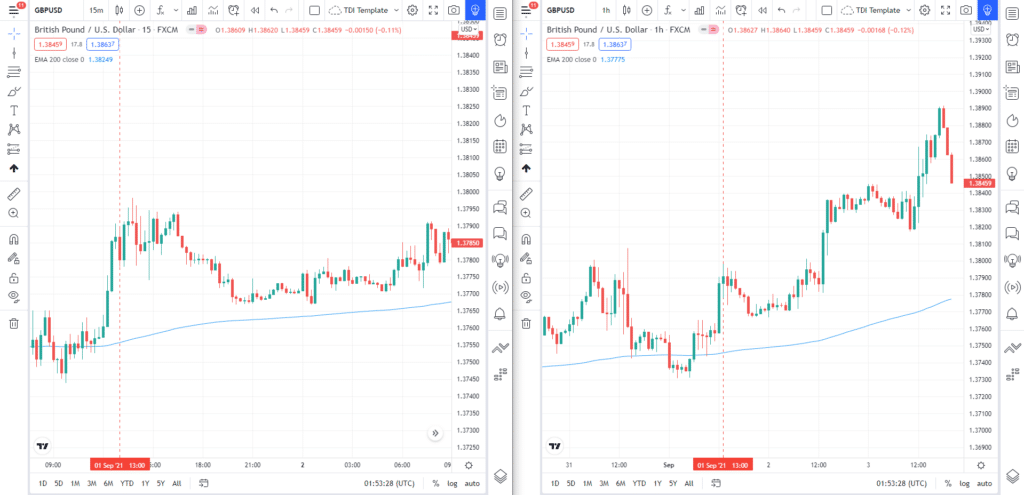
Let’s consider a trade example on GBP/USD that occurs on 1 September 2021. You can see the 15-minute and hourly charts put side by side in the above image. Looking at the charts, you can easily tell that the market is generally trending up on H1 and M15 since the price is above the 200 EMA in both charts. Therefore, the first step is satisfied.
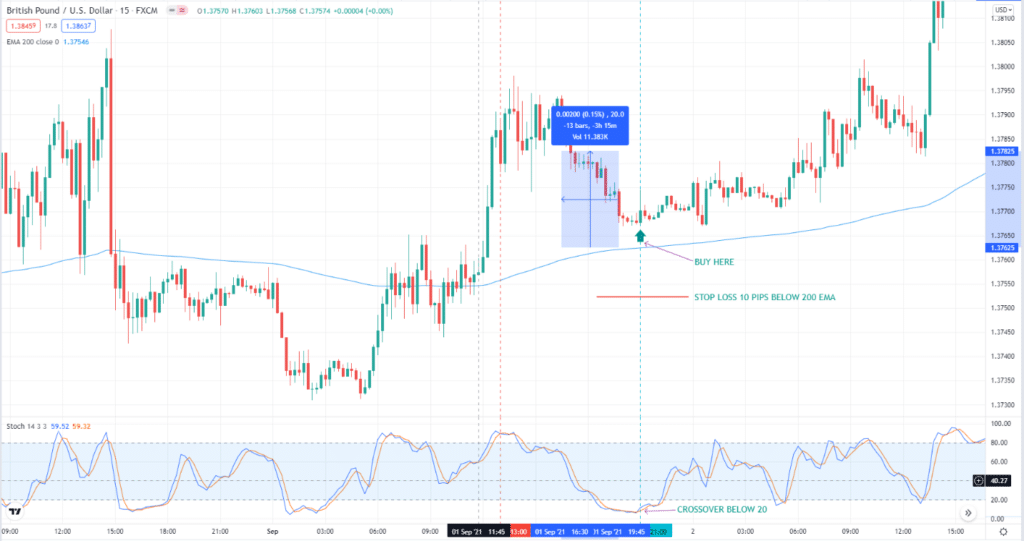
For the second step, we focus our attention on the M15 chart. In the above image, you can see that the price is approaching the 200 EMA. This is a good thing since we are looking for a pullback.
When the price is within 20 pips from the 200 EMA, that is the time that you can start looking for a buy entry, pending a stochastic crossover in the oversold territory. After a while, we have seen the expected crossover below 20. That is marked with a green up arrow above. Therefore, you are now ready to take a long trade.
After your entry, put the stop loss ten pips below the 200 EMA. The actual risk in the trade is more significant than ten pips because there is a slight gap between the price and the 200 EMA. If the entry happens to be a wrong call, you can exit your trade with minimal loss.
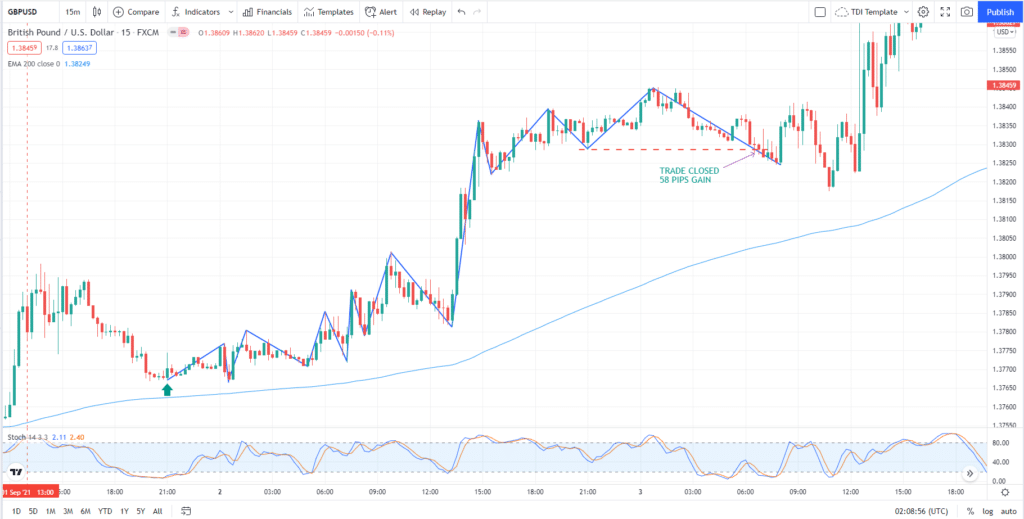
When the trade moves in your favor, manage the trade in the manner shown in the image above. Trade management is done on the M15 chart. Every time the price makes a new high, move your stop loss to the recent swing low. As the above chart depicts, you could have moved your stop loss seven times before the price finally takes you out of the position. In the end, you manage to make 58 pips in the trade.
Final thoughts
This short-term trading method works well in the FX market but is also applicable to other markets. Each step of the system helps identify areas where you can make effective trades. If one of the criteria is not met, you will instantly know not to make a trade.
This model also gives you the freedom to experiment with different chart intervals. When you are equipped with a system that can help you catch the trend early, you can wait for the rest of the market to follow. This system is one way to take advantage of short-term currency trends.